-
Welcome To Damiina E-learning
-
Module 1: Introduction to Cryptocurrency
-
Module 2: Understanding Blockchain Technology
-
Module 3: Introduction to Airdrops, Tokens, and Coins
-
Module 4: Cryptocurrency Wallets, Top Exchange Centers, and Security
-
Module 5:GETTING STARTED WITH CRYPTO TRADING
-
MODULE 6: TYPES OF TRADE ON BINACE
-
MODULE 7: MEMCOIN
-
MODULE 8: TRADING PSYCHOLOGY
-
MODULE 9: NFT (NON-FUNGIBLE TOKENS)
Crypto Chart Patterns and Time Frame
Time Frames in Crypto Trading:
- Long-Term (for Investors):
- Weekly (W): Big picture view, track long-term trends.
- Monthly (M): For long-term investors, very broad trend analysis.
- Medium-Term (for Swing Traders):
- Daily (D): Tracks daily trends, good for swing trades.
- 4-Hour (4H): Shorter trends, helps in making trades lasting a few days.
- Short-Term (for Day Traders/Scalpers):
- 1-Hour (1H): Short-term trades, captures quick price moves.
- 30-Min (30M): More detailed for short-term trades within a day.
- 15-Min (15M): Quick decisions for day trades.
- 5-Min (5M): Ultra-short-term, quick trades.
- 1-Min (1M): For scalpers, very rapid trades.
Choosing the Right Time Frame:
- Shorter Time Frames: For quick trades (scalping/day trading).
- Medium Time Frames: For swing traders, capturing trends over a few days.
- Longer Time Frames: For long-term investors, focusing on overall market direction.
Chart Patterns
Chart patterns are visual formations created by the price movements of a cryptocurrency on a chart over time. These patterns are used to forecast future price movements based on past behavior.
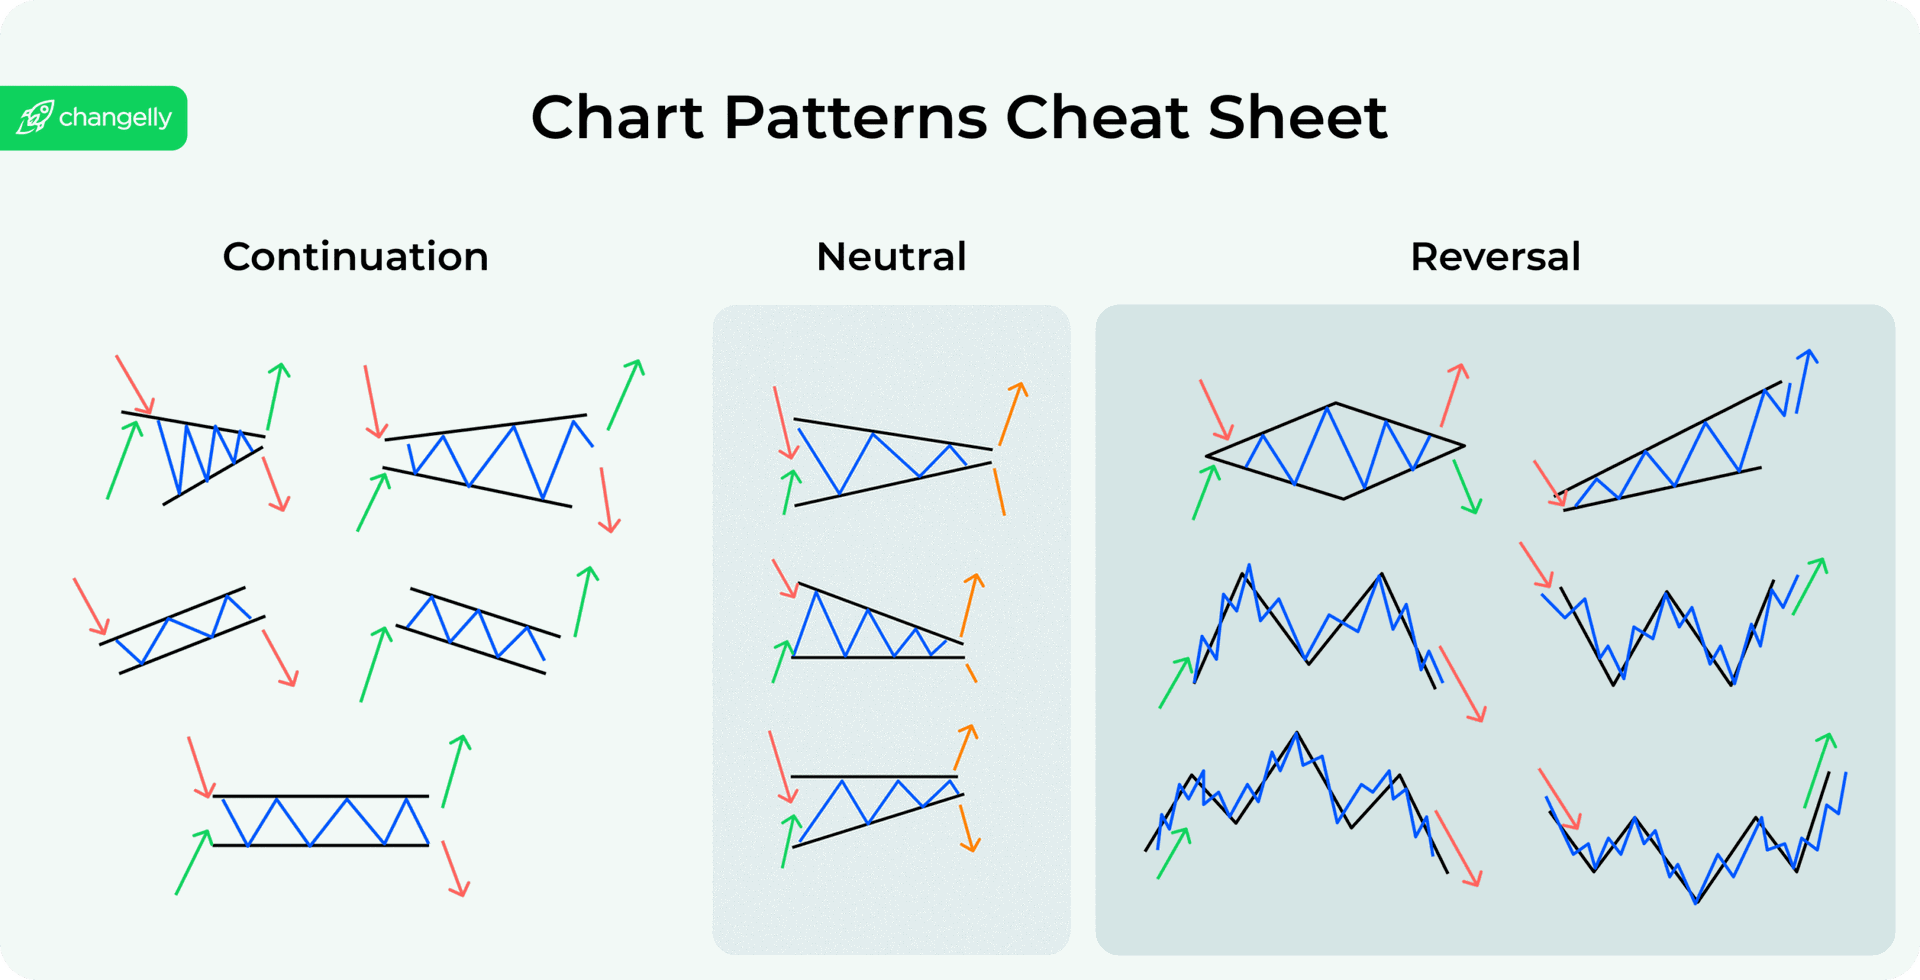
Types of the chart pattern:
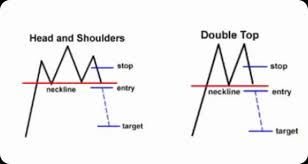
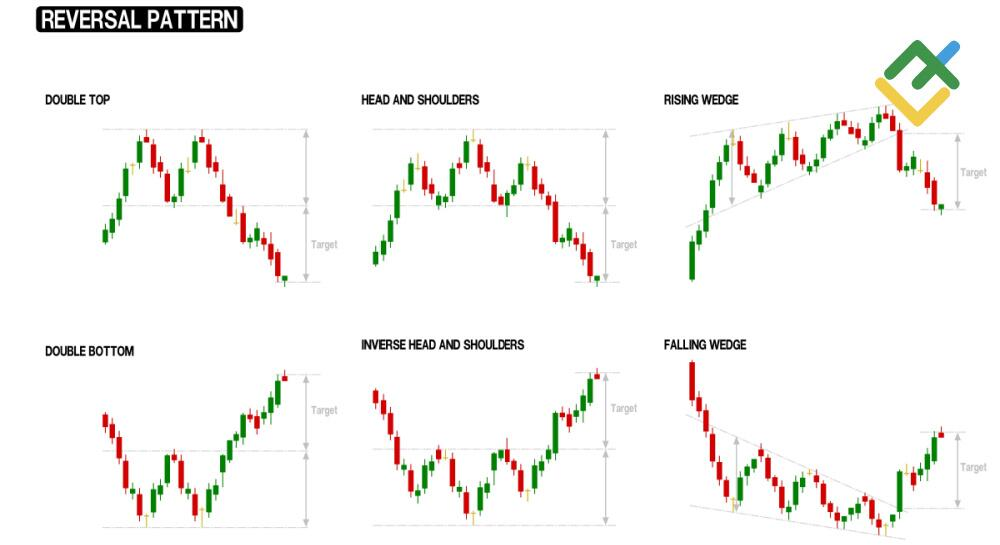
Reversal Patterns: Indicate a change in the trend direction. Examples: Head and Shoulders, Double Top/Bottom and rising wedge.
Continuation Patterns: Indicate the trend will continue in its current direction. Examples: Triangles, Flags, Pennants.
Rating
1
0
There are no comments for now.